Microsoft Power BI
Using Power BI for data-driven analytics allows businesses to harness their wealth of data, transforming it into actionable insights. From customer and employee data metrics to sales and acquisitions, Power BI facilitates this process by seamlessly integrating disparate data sources into coherent, visually engaging, and interactive insights. Additionally, Power BI offers AI-driven insights to spot trends and anomalies.

Power BI consists of several elements working together
A Windows desktop application for connecting to, transforming, and visualizing data. It allows you to create data models, build visuals,
An online Software as a Service (SaaS) platform where you can consume, interact with, and share reports and dashboards. It
Mobile applications are available for Windows, iOS, and Android devices, enabling you to access and
A tool for creating paginated reports to share in the Power BI Service, offering more structured and printable
An on-premises report server where one can publish their Power BI reports, created using Power BI Desktop, for

Features of Power BI
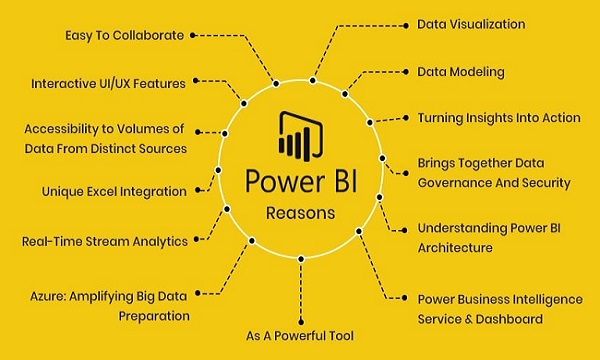
Convert various types of data into charts and graphs for easier understanding and decision-making.
Collaborate with colleagues using the same trusted dashboards and reports, accessible from browsers or mobile devices.
Data updates and refreshes automatically, ensuring you're always working with the most recent information.
Utilize intuitive features to explore data further, identify trends, insights, and other business intelligence.
Filter, slice, subscribe, and export content without affecting the original dataset.
View and export data used to create visuals, export entire reports to PowerPoint or PDF for sharing.
Instantly view the impact of selecting values in one visual on other visuals in the report.
Add comments and start conversations with colleagues directly within the dashboard.
Set up subscriptions and alerts to receive notifications via email when data changes or reaches specific thresholds.
Easily locate and view content using the Home canvas, navigation pane, and global search.
Explore dashboards with tiles that tell a story and dive into reports with various visualization options.
Share content with colleagues through links, apps, or directly from the Power BI service.
Add comments to dashboards or specific visuals, and mention colleagues using the ‘@’ sign for collaboration.
Print dashboards, reports, tiles, or visuals for offline use or export reports to PowerPoint for further sharing and customization.

Microsoft Power BI Services
As Microsoft Power BI Partners, we provide services for implementing Microsoft Power BI, ranging from providing all required information including pricing and features to implementing the solution according to your organization’s needs.
Our consultants provide excellent guidance and support for your day-to-day needs. Contact us 24×7 to get answers to your queries related to Microsoft Power BI.
SAN Dynamics is the leading Microsoft power bi implementation partner in Australia (Sydney, Melbourne, Brisbane, Perth, NSW), known for its futuristic solutions and unmatched customer service.